Guides · The practical playbook
Three Trading Setups. One Risk Rule. A Plan You Can Actually Follow.
Breakouts, failed breaks and trend pullbacks—illustrated step by step. Learn what to wait for, what makes each idea wrong, and when the best trade is no trade.
The chart looks obvious after the move. Before it, every candle seems to offer a different story.
That is where a useful trading technique earns its place: not by predicting the next candle, but by telling you what to wait for, what would make the idea wrong, and when to leave it alone.
This is a practical playbook for three familiar situations: a breakout that holds, a breakout that fails, and a pullback within a trend. Each has a different job. The mistake is asking one to do all three.
These are research frameworks, not tested profit claims or trade recommendations. The diagrams are invented examples, not selected winners from a backtest. Start in simulation; execution costs and losses are real even when a chart looks convincing.
First, decide which game the market is playing
Before choosing an entry, zoom out one timeframe. You are looking for context, not permission from another indicator.
| What you can actually observe | The question worth asking | A reason to stand aside |
|---|---|---|
| Price repeatedly turns near the same boundaries | Is the range still holding, or is price establishing itself outside it? | The boundaries keep changing as you redraw them |
| Higher highs and higher lows, or the reverse | Can a pullback hold the structure that defines this trend? | The latest swing already broke that structure |
| A fast move beyond a well-defined boundary | Does it hold outside, or return inside? | The move is so extended that the next obstacle is already close |
Mark a zone around the relevant high or low, not a razor-thin line fitted to the last wick. Support and resistance are areas of interest, not barriers the market must respect; CME's introduction explains this distinction.
Then choose one setup to investigate. Mixing a trend entry, a range target and a breakout stop produces a trade that is difficult to evaluate afterwards.
1. The breakout and retest: make the market come back to you
The tempting version is simple: price crosses resistance, so you buy. The more deliberate version asks what happens when that area is tested again.
For a long-side paper-trading example, mark a resistance zone before the break. Define your timeframe and require a completed candle above the zone. Then wait for a return towards it. A retest that closes back above the zone gives you a specific observation to investigate—not a guarantee of continuation.
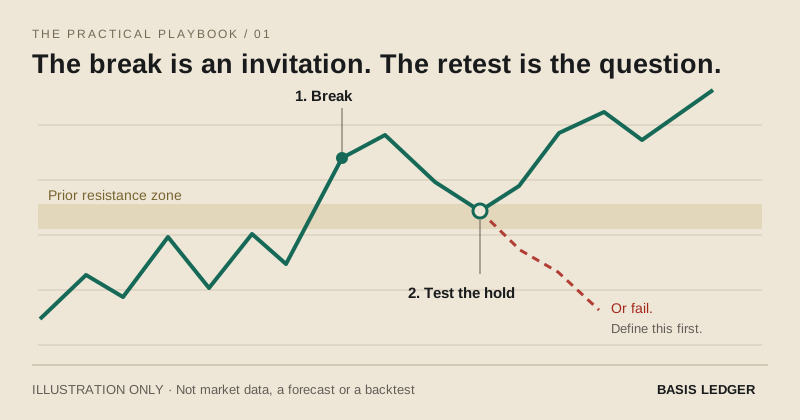
Make the rule reproducible. One example is: a close above the zone, followed by a retest candle that closes above it, then a move above that candle's high. Record the zone, candle and proposed execution price before the outcome is known. A rule such as “it looked strong” cannot be reviewed consistently.
Define failure first. Which price would invalidate the hold? A planned protective exit below the retest low is one possible construction; it is not automatically the right distance for every market. Decide the rule in advance rather than moving it when the trade becomes uncomfortable.
Look at the space ahead. If the next marked resistance sits almost on top of your proposed entry, the chart may offer too little room relative to the invalidation distance and costs. Missing a move is preferable to rewriting the plan to justify chasing it.
Skip it when: the breakout runs away without a retest, the retest returns deep into the old range, or you cannot state what a valid hold looks like. No retest means no trade under this particular rule—not an instruction to invent a second entry.
2. The failed break: trade the return, not the dramatic wick
A candle briefly pushing beyond a range is not proof that a reversal is coming. The useful question is whether price can remain outside that range.
Imagine a move above a previously marked range high, followed by a completed candle back inside. A short-side research rule might then wait for a retest of the high from below that also closes inside. You are studying a failure to hold outside, not trying to sell every new high.
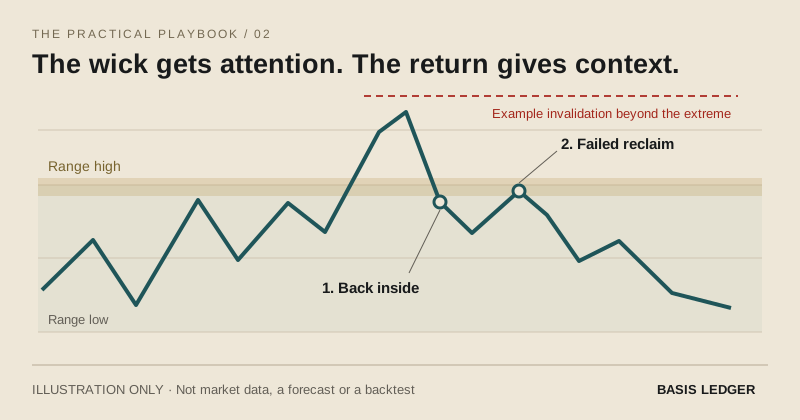
The trigger: write down exactly how you define the return and the failed reclaim. For example, a close back inside followed by a retest candle that cannot close above the zone. Choose that definition before collecting results.
The invalidation: a preselected price beyond the failed-break extreme, with execution assumptions stated. If you instead use candle-close invalidation, remember that the intrabar loss can be larger than the loss implied by a neat closing-price chart.
The first question about an exit: is there meaningful room to the middle of the range? Treat the midpoint as a review location, not a promised destination. Do not quietly change a range trade into a long-term reversal thesis because it is losing.
Skip it when: the broader market is trending strongly, price keeps closing outside the range, or a scheduled announcement is about to change the conditions you assessed. A failed-break rule and a breakout-continuation rule can produce opposite hypotheses at the same level. Your predefined evidence—not your preferred direction—must decide which one is active.
3. The trend pullback: buy a location, not a feeling
An uptrend is not simply a green candle. For this exercise, define it as a sequence of higher swing highs and higher swing lows on your chosen context timeframe. Use the inverse for a downtrend.
Mark a prior breakout area or a reference swing before price returns to it. The goal is to observe whether the pullback preserves that structure, rather than guessing that every dip is cheap.
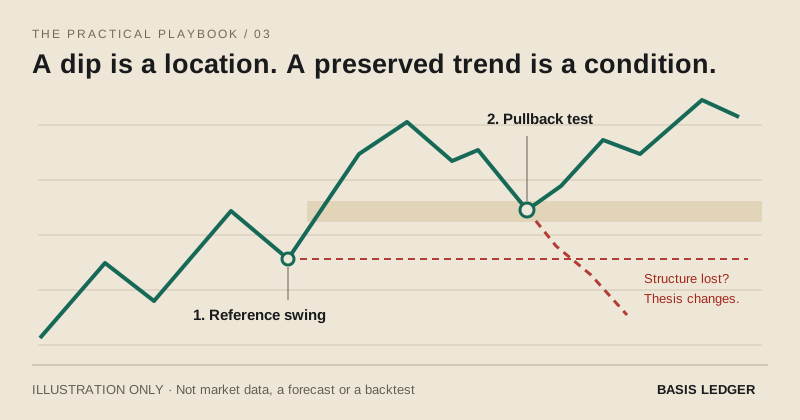
The trigger: in a long-side example, wait for a pullback to the marked area and a completed candle that turns back up, then specify the price condition required for entry. Pick a consistent swing definition; changing which lows “count” after seeing the result makes the exercise meaningless.
The invalidation: the reference low your thesis depends on, with a predetermined execution rule. If that low breaks, “the bigger trend is probably fine” is a new thesis, not a reason to enlarge this trade's risk.
The trap: several red candles do not necessarily make an asset discounted. A pullback can become a trend change. If price no longer preserves the structure you defined, you no longer have this setup.
Skip it when: you only recognise the trend after a vertical move, the pullback breaks your reference swing, or the potential entry is too close to the previous high to justify the planned risk and costs.
Use order flow to challenge the idea—not decorate it
Once a price-based hypothesis is written, footprint and CVD can add a second question: what did executed buying and selling do at that location?
For example, at a failed break, you might investigate whether aggressive buying increased while price struggled to make further progress. At a pullback, you might inspect whether selling pressure continued without producing a new low. Neither observation proves absorption, identifies who traded, or tells you what happens next.
Keep the comparisons honest: use the same instrument, exchange, interval and time window. CVD accumulates a chosen definition of buy-minus-sell volume; its starting point and data coverage matter. A reset, missing history, a different venue or different candle aggregation can change the apparent divergence. Read the indicator's data description before comparing lines.
An order-book heatmap answers a different question: where visible resting liquidity was observed. It is not a record of executed volume or hidden liquidity. Gaps in captured book data are not proof that liquidity disappeared. If the required data is missing, label the observation “unknown” and leave it out of the conclusion.
In Basis, use the terminal to mark the setup first, then inspect footprint or Order Flow around the relevant test. A compelling screenshot is not statistical evidence that the setup has an edge.
The one rule shared by all three: size the risk before the entry
An attractive setup with uncontrolled size is still uncontrolled risk.
For a simple linear instrument quoted in dollars, a starting calculation is position units = planned price-move risk ÷ distance from entry to protective exit. Contract multipliers, inverse contracts, fees, funding, slippage and liquidation rules require additional treatment; do not apply this equation blindly to every product.
| Hypothetical example | Calculation |
|---|---|
| Entry | $100 per unit |
| Planned protective exit | $98 per unit |
| Price distance | $2 per unit |
| Price-move risk budget | $10, before costs |
| Position size | $10 ÷ $2 = 5 units |
| Notional exposure | 5 × $100 = $500 |
| If sold at $104 | $20 gross gain, or 2R before costs |
Here, R means the initial planned $10 price-move risk, not a guaranteed maximum loss. If round-trip costs were $1 and fills matched the example, the winning outcome would be $19, or 1.9R; the stop outcome would be a $11 loss, or −1.1R. Those cost assumptions are illustrative, not an exchange quote.
A stop price is not a guaranteed fill price. Fast markets and gaps can produce worse execution; a stop-limit order can fail to execute at all. FINRA explains these order-type risks. Check the rules of your own venue and instrument, particularly when using leverage.
The practical lesson is not “use this percentage.” It is know what would make the idea wrong, estimate the loss and costs, then decide whether the position is appropriate at all.
A one-minute plan you can copy
Before a simulated trade, write these six lines in a chart note or journal:
- Context: trend, range or transition; instrument, venue and timeframe.
- Location: the zone marked before price reached it.
- Trigger: the exact observation required—not “looks bullish.”
- Invalidation: the price or condition that cancels the idea, plus the exit method.
- Risk and room: size, estimated costs and the first opposing level.
- No-trade condition: the event or missing evidence that makes you stand aside.
Save the chart before the outcome. Afterwards, record whether the rule was followed, the actual fills and costs, and what happened—not just whether the position won.
A small practice batch can expose ambiguous rules. It cannot establish a reliable edge. To evaluate a technique seriously, include losing and skipped examples, separate trend and range conditions, avoid picking only memorable charts, and test unchanged rules on later data. Report the number of observations alongside any result. Win rate alone omits how much each winner and loser was worth.
A useful setup does not make uncertainty disappear. It makes your decisions clear enough to review.
Pick one of the three. Mark its conditions on a chart. If you cannot explain the invalidation in one sentence, keep researching rather than clicking.
And if you share the analysis, share the reasoning too: the timeframe, the condition you are waiting for, and what would change your mind. That is more useful to another trader than a confident arrow.
Educational research only. No strategy here is presented as profitable, validated or suitable for your circumstances. Trading, particularly with leverage, can cause substantial losses.
8 min read · Filed to Guides · Nothing here is investment advice.