Guides · An idea, put to the test
You Have a Trading Idea. Here’s How to Test It Without Writing the Code Yourself.
From entry rules to a backtest and signals on your chart: a practical Agent Plus walkthrough, including the checks that keep a convincing result from becoming false confidence.
You have probably had this thought while looking at a chart: what if I only took the breakout when volume confirmed it?
Then comes the work. Define the rules. Write the code. Fix the errors. Add trading costs. Check whether the signals actually mean what you intended.
With Agent Plus, you can start that work in plain English, inside Basis. This walkthrough shows a real session: an idea became code, a historical test, a saved strategy and signals on the chart. It also shows the follow-up that was needed to finish the job.
The example lost money. We kept it. A useful research tool should help you challenge an idea, not just produce an attractive answer.
Start with a question you can actually test
Our question was simple: does a Bitcoin breakout with above-average volume hold up in a recent sample?
We used BTC/USDT on the Binance perpetual market, with one-hour candles. These were the rules:
- Enter long after a completed candle closes above the highest high of the previous 20 completed candles, with volume above their 20-candle average.
- Exclude the signal candle from both comparisons. Otherwise, the question changes.
- Enter at the next candle's open, not retroactively at the price that triggered the signal.
- Exit at the next open after a completed candle closes below the previous 10 candles' lowest low.
- Hold one long position at a time. No shorts or leverage. Include commission and slippage on both sides.
This is a research example, not a recommended trading system. The point is to turn a specific question into something you can inspect.
Give Agent Plus the rules—and the boundaries
Here is the actual request from the session. There is a copyable version at the end of this article.
Build a research strategy for BTC/USDT on the 1-hour chart. Go long when a completed candle closes above the highest high of the previous 20 completed candles and its volume is above the average volume of the previous 20 completed candles. Exclude the signal candle from both comparisons. Use one position at a time, no shorts and no leverage. Enter at the next candle's open. Exit when a completed candle closes below the lowest low of the previous 10 completed candles, at the next candle's open. Include 10 bps commission and 5 bps slippage per side. Backtest only the data actually available. Report the exact date range, number of trades, net return and maximum drawdown, and explain the execution assumptions. Save it as "Ledger — Volume Breakout" and add entry and exit signals to my chart, even if the result is negative. Do not place any real orders. If a rule or metric cannot be supported, tell me instead of substituting it silently. Please answer in English.
Notice what we did not ask: “Find me a profitable strategy.” We specified the experiment, the costs and what would count as a complete answer.
Agent Plus generated strategy code, tested it, repaired it and ran the test again. The saved code used lagged high, low and volume calculations: the signal candle was excluded from the comparison windows.
You do not have to write that code yourself. You do still need to check that the code answers your question.
Finish the workflow, not just the conversation
The first response added two indicator panes showing when the entry and exit conditions were true. That is useful for debugging, but a condition being true is not the same as a simulated trade being filled.
We followed up: save the tested strategy to Strategy Lab → AI, keep the same rules and costs, and show simulated entries and exits on the price chart. We also asked which candles had been tested and whether funding was included.
The strategy was then saved as Ledger — Volume Breakout. We opened Strategy Lab independently, found it under the AI filter, inspected its code and execution settings, and checked the historical labels on the chart. No real orders were placed.
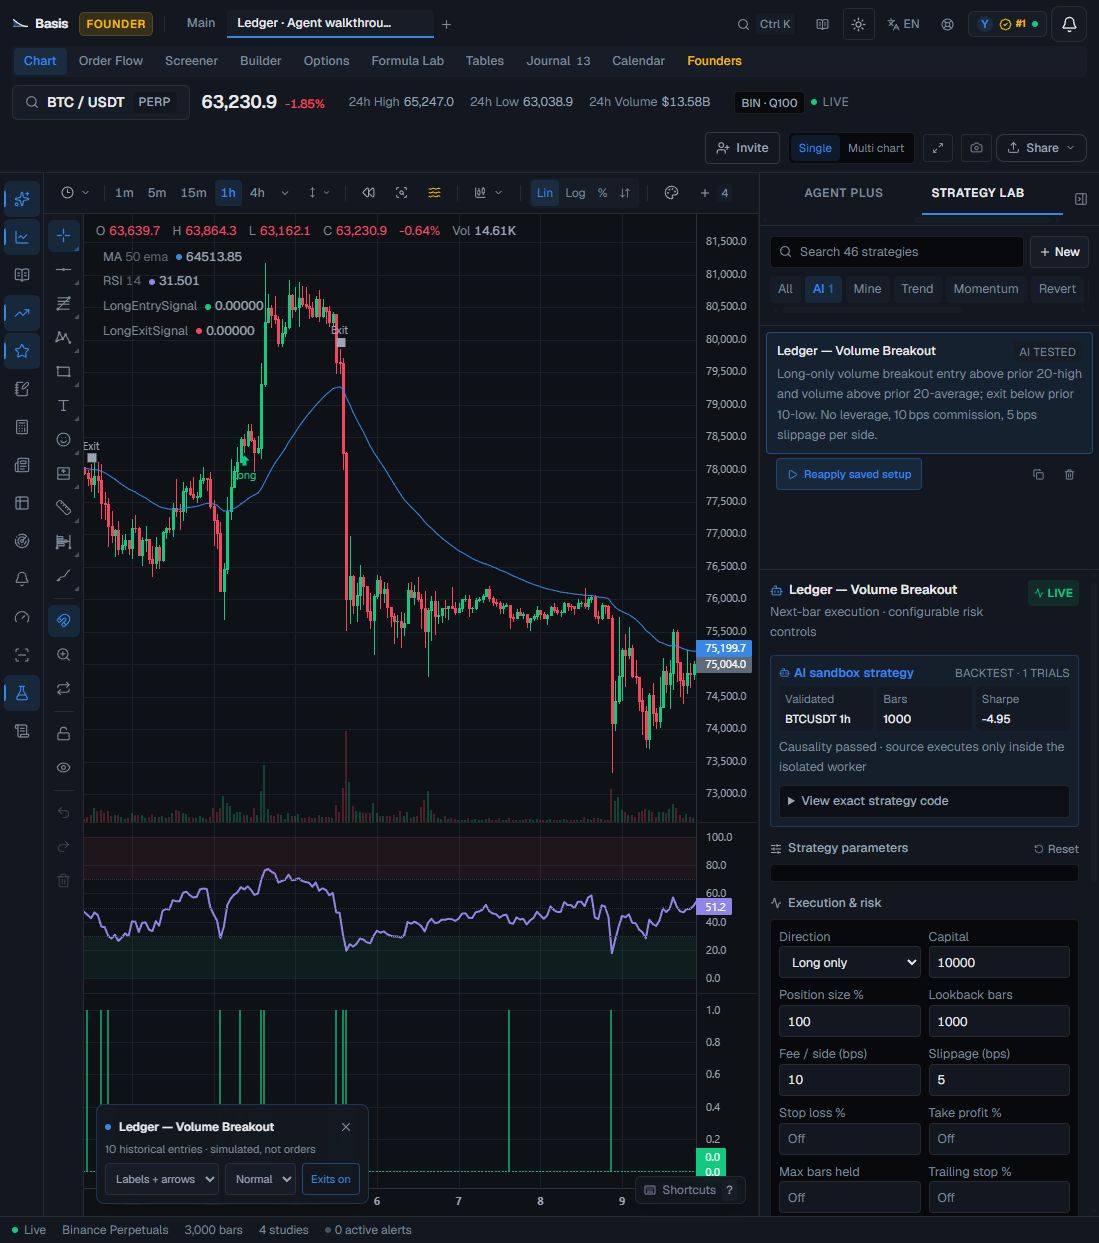
You are not left with a paragraph about a strategy. You have an inspectable object in your research workspace.
Read the result before believing the idea
The Agent reported a window of October 8, 2026, 00:00 UTC to November 18, 2026, 15:00 UTC, covering 1,000 closed one-hour candles. The terminal had 3,000 candles loaded, so we explicitly set Strategy Lab's lookback to 1,000 before comparing the results. Its return, drawdown and trade count matched the Agent's report.
| Test item | Observed setting or result |
|---|---|
| Market | BTC/USDT, Binance perpetual, 1h |
| Lookback | 1,000 candles |
| Simulated capital | $10,000 |
| Position allocation | 100% of simulated equity, long only, no leverage |
| Commission | 10 basis points per side (0.10%) |
| Slippage | 5 basis points per side (0.05%) |
| Funding | Excluded |
| Trades | 10 |
| Net return after the modeled costs | −7.49% |
| Maximum drawdown | 7.49% |
| Win rate | 10.0% |
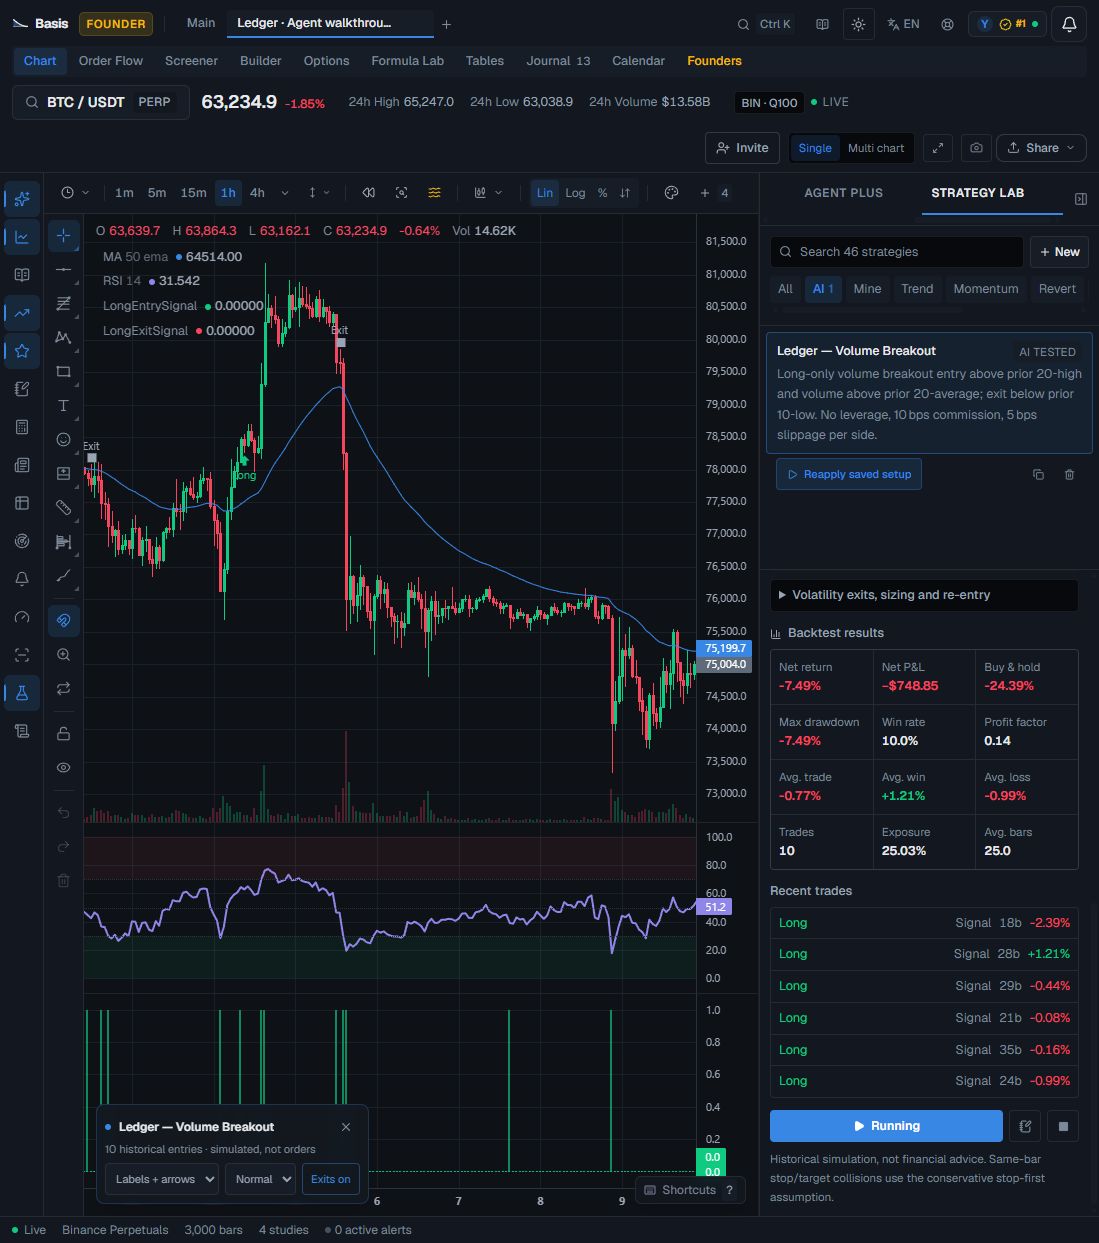
Ten trades cannot establish a durable edge. Funding was not loaded, so this is not an all-in perpetual-futures performance result. Slippage is a fixed assumption, not reconstructed exchange fills. The test used next-bar execution and had “Close at end” enabled. Allocating 100% of equity does not mean a defined 100% stop-loss risk; no separate stop-loss was configured.
The wider 3,000-candle chart calculation initially showed a different result. Comparing it with the Agent's 1,000-candle test would have mixed two experiments. Match the market, timeframe, window and costs before comparing numbers.
What would you ask next?
Do not keep changing the rules until the recent chart looks good. A more useful follow-up is:
Keep the entry and exit rules unchanged. Test them on a separate, non-overlapping period if the data is available. Then repeat with higher commission and slippage. State the exact windows and any missing costs. Do not claim that a profitable backtest predicts future returns.
You can use the same approach for an indicator you want to build, a filter you want to compare, or a setup you want to investigate. Be specific about the market, timeframe and expected output. Review the result before relying on it. Agent Plus is in beta and can make mistakes; this session needed a follow-up, and another run may need different corrections.
Bring your own idea
The value is not this particular breakout. It is being able to move from “I wonder if…” to rules, code, a test and something you can inspect on your chart—without starting from a blank editor.
Agent Plus is included with both Founder membership plans, without requiring your own API key. AI usage allowances apply; check the current membership details. The free Basis terminal and visual Builder remain available if you prefer to do the work yourself.
Start with one question you have wanted to test. Keep the first experiment small enough that you can tell whether the answer is right.
Product walkthrough recorded on November 18, 2026. Screenshots are from the actual Basis session, not mockups. Historical simulations and AI outputs are research aids, not investment advice, execution guarantees or promises of future returns.
5 min read · Filed to Guides · Nothing here is investment advice.